Site Map
Home Page
Process Engineer
Chart Digitizer
Topic Editor
Video Timer
Photo Music
PLC Simulator
Android Timer
Alien Vision
Feedback
About GTS

GT Timer and Counter
Examples
 There are several common type of events that someone would want to time or count:
For example, one person in an event repeatedly.
For example, a group of people running a stage race.
For example, a group of people working a production line.
For example, counting cars on a highway.
The Android Timer & Counter is designed to work with these type of events and generates timing statistics so these events can be analyzed in detail.
The secret to using the Android Timer & Counter is the Delta Times that are displayed with each entry in the log files. These Deltas display the time difference between a particular log entry and the entries before it.
Each log entry includes these five Deltas:
The log files include this information on each entry.
The Stats chart on the Graph page is the average of these numbers.
The Delta charts on the Graph page shows each of the 5 delta values on a timeline vrs each of the tasks.
The logs and summary info is saved in a comma-separated format for easy insertion into a spreadsheet.
Below are several examples of how to use the Timer Counter to streamline your data gathering.
Timing your daily time management.
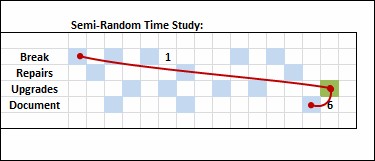
Joe's boss wants him to track how he spends his time throughout the day.
So he writes up a list of tasks that he knows he'll be doing: Breaks
Equipment Repairs
Product Upgrades
Documentation
He starts with a short list and will add more categories as they happen.
He starts the day with "Break" to mark time-zero, then clicks a task name when he finishes each task.
Most tasks will have several entries in the log as he jumps from job to job.
At the end of the day, Joe is only interested in Delta-6, which is the time for each log entry from the entry before it.
The Delta-6 time is therefore the time spent on each log entry.
The Stats Chart on the Chart page shows the sum of these times for each task item.
And Deltas Chart shows all Delta-6 times for each task.
Joe's boss wants him to track how he spends his time throughout the day.
So he writes up a list of tasks that he knows he'll be doing:
He starts with a short list and will add more categories as they happen.
He starts the day with "Break" to mark time-zero, then clicks a task name when he finishes each task.
Most tasks will have several entries in the log as he jumps from job to job.
At the end of the day, Joe is only interested in Delta-6, which is the time for each log entry from the entry before it.
The Delta-6 time is therefore the time spent on each log entry.
The Stats Chart on the Chart page shows the sum of these times for each task item.
And Deltas Chart shows all Delta-6 times for each task.
Counting vehicle types on a highway.
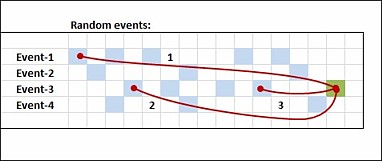
Joe wants to determine the ratio of sedans to pickup trucks in several cities across the country. Rather than taking a month to visit half the country, Joe dials up the highway traffic cams on the internet. Most cities have a dozen of these, so in one day he can gather traffic info from a dozen cities without leaving home. Joe enters these steps into the task list of the Android Timer: LA Sedan
LA Pickup
He visits the web page for the Los Angeles traffic cams and studies 3 different cams for ten minutes each. As he watches, each time a sedan passes the camera he touches "sedan" on the screen. Each time a pickup passes the camera he touches "pickup" on the screen.
He then visits the web page for a dozen other cities and adds more names: Sea Sedan
Sea Pickup
Dal Sedan
Dal Pickup
The data is gathered at each location in the same way, appending each city's logs to the LA listing. The finished data file includes a summary that shows the count of each vehicle type: LA Sedan , 75
LA Pickup , 35
Sea Sedan , 70
Sea Pickup , 30
Dal Sedan , 65
Dal Pickup , 50
This table can be popped into a spreadsheet for statistical analysis.
The time stamps in the log listing can be used to correlate time of day.
Joe only wanted the counts and didn't use the Delta's in this example.
Joe wants to determine the ratio of sedans to pickup trucks in several cities across the country. Rather than taking a month to visit half the country, Joe dials up the highway traffic cams on the internet. Most cities have a dozen of these, so in one day he can gather traffic info from a dozen cities without leaving home. Joe enters these steps into the task list of the Android Timer:
He visits the web page for the Los Angeles traffic cams and studies 3 different cams for ten minutes each. As he watches, each time a sedan passes the camera he touches "sedan" on the screen. Each time a pickup passes the camera he touches "pickup" on the screen.
He then visits the web page for a dozen other cities and adds more names:
The data is gathered at each location in the same way, appending each city's logs to the LA listing. The finished data file includes a summary that shows the count of each vehicle type:
This table can be popped into a spreadsheet for statistical analysis.
The time stamps in the log listing can be used to correlate time of day.
Joe only wanted the counts and didn't use the Delta's in this example.
Timing yourself on an obstacle course.
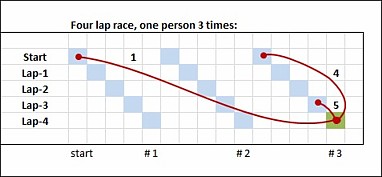
Amy wants to time herself through four stations of an obstacle course, and watch her improvement after several trials. She enters these steps into the task list of the Android Timer: Start
Step-1
Step-2
Step-3
Step-4
She runs the obstacle course several times, with a rest in between and adjusts her technique each time. When she's finished, she examines the log files to chart her progress. All five steps will be in the log three times each, in the order she does them.
Useful info can be read right off the delta times: T-4 of Step-5 = the time for each complete race.
T-5 of each step = the time for just that step.
The summary chart will show the average time for each step.
With this info she can see if each race is getting faster and which step is improving or not.
Amy wants to time herself through four stations of an obstacle course, and watch her improvement after several trials. She enters these steps into the task list of the Android Timer:
She runs the obstacle course several times, with a rest in between and adjusts her technique each time. When she's finished, she examines the log files to chart her progress. All five steps will be in the log three times each, in the order she does them.
Useful info can be read right off the delta times:
With this info she can see if each race is getting faster and which step is improving or not.
Timing a group of kids running a mile.
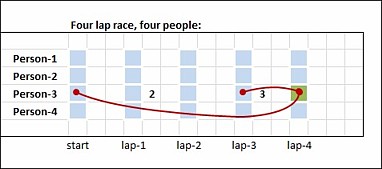
This is slightly different from the race above because in this case four kids are running at the same time. All kids start at the same time, and each one run four laps around the quarter mile track. Amy enters the names of the kids into the task list: Andy
Bill
Chad
Dave
When the race starts, Amy clicks the LOG ALL button and the runners launch into the first lap. As each runner completes each lap, Amy will touch their name on the task list. When the race is finished there will be 20 entries in the log listing.
The delta-times include lap times by each runner: T-2 of each person = their time at the end of each lap.
T-3 of each person = their time for each lap.
This is slightly different from the race above because in this case four kids are running at the same time. All kids start at the same time, and each one run four laps around the quarter mile track. Amy enters the names of the kids into the task list:
When the race starts, Amy clicks the LOG ALL button and the runners launch into the first lap. As each runner completes each lap, Amy will touch their name on the task list. When the race is finished there will be 20 entries in the log listing.
The delta-times include lap times by each runner:
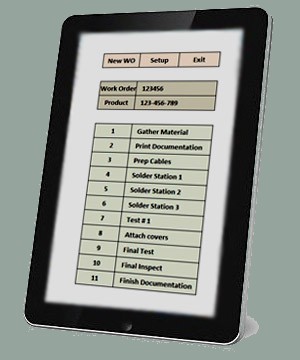
Timing multiple steps on your production line.
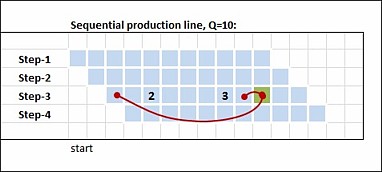
The assembly line is running slowly and Joe wants to find where the bottleneck is. On this line, four people assembly toys from a kit of parts. It is a sequential flow from one person to the next and product appears to be backing up behind some workers but not others. These steps are entered into the Android Timer app: Assemble components
Solder wires
Assemble chassis
Electrical test
Joe then watches the line run. He must start the timer when each person starts their first piece and when they finish each piece. When ten products are finished, the log will have 44 entries in production order.
Joe reads the delta times from the summary page because he is only interested in averages: T-2 of any entry = build time up to that step.
T-3 of any entry = time to build one piece.
Note that T-4 & T-5 won't add up because of poor timing between steps.
From his info, Joe found that person 2 is too fast and person 4 is too slow. Those two people are swapped and the test is rerun. This puts the fast person on the slow process and slow person on the fast process, giving the line a better balance.
The assembly line is running slowly and Joe wants to find where the bottleneck is. On this line, four people assembly toys from a kit of parts. It is a sequential flow from one person to the next and product appears to be backing up behind some workers but not others. These steps are entered into the Android Timer app:
Joe then watches the line run. He must start the timer when each person starts their first piece and when they finish each piece. When ten products are finished, the log will have 44 entries in production order.
Joe reads the delta times from the summary page because he is only interested in averages:
From his info, Joe found that person 2 is too fast and person 4 is too slow. Those two people are swapped and the test is rerun. This puts the fast person on the slow process and slow person on the fast process, giving the line a better balance.
Gathering time and quantity info for a Kaizen event.
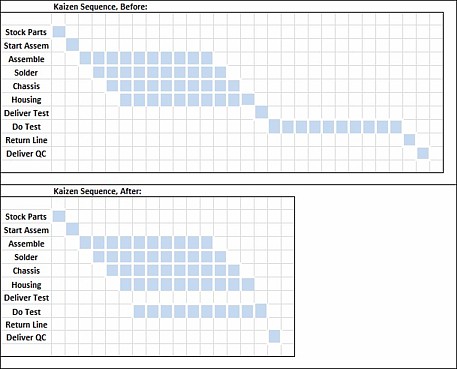
A Kaizen event is similar to streamlining a production line except the Kaizen will include footwork and paperwork. The Kaizen will run the sequence normally, to accurately capture non-production bottlenecks. 1 (1) Stock parts on line
2 (1) Start to assemble
3 (10) Assemble components
4 (10) Solder wire
5 (10) Assemble chassis
6 (10) Assemble housing
7 (1) Deliver to test room
8 (10) Do electrical test
9 (1) Return to line
10 (1) Deliver to QC
The tasks marked with (1) will appear in the log files one time. Those with (10) will appear ten times. This makes the log files very confusing but still useful. They then run the process to build a quantity of ten. The steps are numbered to make the explanation easier to follow. T-1 of the final step = the time it takes to built ten products.
T-2 of any entry = time to build that step.
T-3 of any entry = time to build one piece.
T-5 of steps 2, 3, 7, 9, 10 = the amount of time spent doing footwork.
The summary of steps 3, 4, 5, 6, 8, shows the time spent on each step of actual assembly.
From this information, they decided to move the test station to the production line, which removed steps 7 & 9 from the process and allows testing of partial orders.
A Kaizen event is similar to streamlining a production line except the Kaizen will include footwork and paperwork. The Kaizen will run the sequence normally, to accurately capture non-production bottlenecks.
The tasks marked with (1) will appear in the log files one time. Those with (10) will appear ten times. This makes the log files very confusing but still useful. They then run the process to build a quantity of ten. The steps are numbered to make the explanation easier to follow.
The summary of steps 3, 4, 5, 6, 8, shows the time spent on each step of actual assembly.
From this information, they decided to move the test station to the production line, which removed steps 7 & 9 from the process and allows testing of partial orders.