Site Map
Home Page
Process Engineer
Chart Digitizer
Topic Editor
Video Timer
Photo Music
PLC Simulator
Android Timer
Alien Vision
Feedback
About GTS

GT Timer and Counter
User's Manual
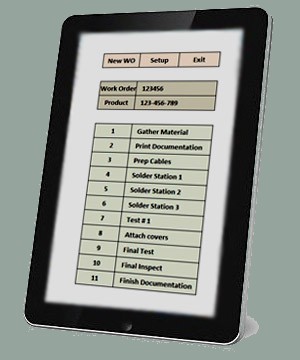 With the Android Timer & Counter a single person can time a whole series of events,
instead of using a team of people with stopwatches.
With the Android Timer & Counter a single person can time a whole series of events,
instead of using a team of people with stopwatches.
Just create a list of tasks on the screen, then while you are watching the event, touch the task on the list each time that task happens. Each touch is logged with its name and time stamp, along with several delta-times. The log of events can be viewed on screen, or uploaded to a bigger computer for additional processing.
The graph screen displays counts, averages and delta times for a quick analysis of your data. Five different delta times display the time difference between each log entry and the entries before it.
Quick Overview:
This program uses a tab interface - four tabs at top will take you to the four main panels.
Before the event starts:
Enter your list of tasks one at a time on Panel 2, the Task Tab.
These should be in the order the events are expected to happen.
You can save this list for future use on Panel 1, the Files Tab.
While the event is happening:
Each time you see a task happen, touch that task on the list.
Each touch will log the task name and time stamp to Panel 3, the Log Tab.
You can review the log listing at any time, during or after the event.
The log listing includes several delta-times for quick analysis.
You can also view charts of the data at any time on Panel 4.
After the event:
On Panel 1, the Files Tab, you can save the log list for future use.
If you take a break, you can reload the task list and log list and then continue.
Note that if you break and reload the program, the delta-times will be messed up.
Logs are saved to public storage where it can be retrieved by a host computer via USB cord.
The Layout Button on Panel 1 will allow you to change the size and placement of the program.
If you touch a tab twice it will popup the help screen for that tab.
Functional Details:
Use Panel 1 to save the TASK and LOG lists.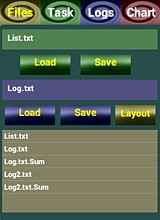
Enter a file name for the TASK List in top edit.
Enter a file name for the LOG list in middle edit.
Each edit has a LOAD and SAVE button.
The Save Prompt will warn you if that file name is already in use.
The Load Prompt will warn you before it overwrites the displayed list.
Saving the Log will also save the summary and deltas, by adding "sum" to the name.
This program can read the log files but not the summary files.
All files will be saved to local storage that is accessible from your main computer through the USB cable.
The Android location is: SDCard/GhostTownSoftware.
The Windows location is: TABLET\Internal Storage\GhostTownSoftware.
The listing at the bottom of the panel shows files in this location.
To copy a filename to an editline: Touch the filename then long-touch the editline.
Every time the program exits it saves the task and logs lists in the BACKUP file. The program will reload these every time it restarts. You can also reload them just like any other file.
The LAYOUT button pops up the layout configuration screen, which is described below.
Use Panel 2 to enter your TASK events.
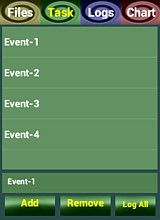
To add task events to the listing:
Enter a task item on the Edit at bottom, then click Add to add it to the list above. These should be entered in the order the events are expected to happen, so the delta-times will be meaningful. A maximum of 50 tasks are allowed.
Hint:
If this is a list of tasks then the first one should be a "start" task. If this is a list of people then the first log entry should be the "start" of the event. The remaining tasks should be clicked when the task ends.
To log task times during the event:
Each time one of the tasks happens, touch that task on the list.
The Time Stamp, Task Name and Deltas will be logged to panel 3.
You can continue to add tasks even while data gathering.
A long-touch will copy an item from the List to the Edit.
To remove a task: long-touch the unwanted task then click REMOVE.
The LOG ALL button will log every item on the list at the same time. This is for an event like a race where everyone starts at the same time. Log-All will prompt first to avoid accidents, and the time stamp will be when the prompt is clicked (not when the log-all button is clicked).
Save the Task List or load a previous Task List at the top of Panel 1.
Save and Load will both prompt to avoid an accident.
Use Panel 3 to display the task LOG.
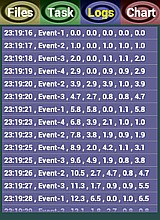
Each time you touch a task item on the Task Panel, the task name and time stamp will be logged to this listing. The log listing includes several delta-times for quick analysis. These are explained below.
Browse this listing but you can not edit it.
Note that the time stamp does not include a date. If the event lasts several days, use a different file each day and include the date in the file name.
Save the log list or load a previous log list in the middle of Panel 1.
Save and Load will prompt to avoid an accident.
If you load a previous log list it will recorrect the delta times.
For a two day session, the delta times will be meaningless.
Every time the program exits it saves the task and logs lists in the BACKUP file.
You can reload these anytime you forgot to save them.
The listing includes these fields and delta-times on each entry:
Time Stamp = Time of day in Hr:Mn:Sec.
Task Name = As listed on Panel 2.
Delta T-1 = from this entry to first log entry, in tenth-seconds.
Delta T-2 = from this entry to first entry of this task.
Delta T-3 = from this entry to previous entry of this task.
Delta T-4 = from this entry to most recent task #1.
Delta T-5 = from this entry to most recent previous task.
Delta T-6 = from this entry to the previous log entry.
The delta-times display the time difference between each log entry and the entries before it. They can be confusing but allow for very quick data analysis. Usually only two or three deltas will apply to a particular task list. See the Delta section below for charts and details.
Fields are separated with commas for use in a spreadsheet.
The log is saved with the exact format as shown on screen.
Each time you touch a task item on the Task Panel, the task name and time stamp will be logged to this listing. The log listing includes several delta-times for quick analysis. These are explained below.
Browse this listing but you can not edit it.
Note that the time stamp does not include a date. If the event lasts several days, use a different file each day and include the date in the file name.
Save the log list or load a previous log list in the middle of Panel 1.
Save and Load will prompt to avoid an accident.
If you load a previous log list it will recorrect the delta times.
For a two day session, the delta times will be meaningless.
Every time the program exits it saves the task and logs lists in the BACKUP file.
You can reload these anytime you forgot to save them.
The listing includes these fields and delta-times on each entry:
The delta-times display the time difference between each log entry and the entries before it. They can be confusing but allow for very quick data analysis. Usually only two or three deltas will apply to a particular task list. See the Delta section below for charts and details.
Fields are separated with commas for use in a spreadsheet.
The log is saved with the exact format as shown on screen.
Use Panel 4 to display a CHART or GRAPH of the logs.
The Graph panel draw three kinds of graphs,
which are selected via the three buttons at bottom.
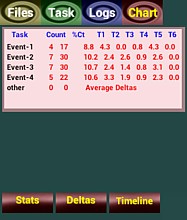
STATS:
Draws a chart of counts and times for each task item.
Each task will list these stats: Count = number of times a task was logged.
% Ct = percent of count vrs the total counts.
The five delta values listed for each task are the
Average or Sum of all Delta-Times for each task.
Click the Stats button to toggle between Average and Sum.
The Delta section below has extensive details. Other = logged items that don't match a task name.
This could happen if you remove or respell an item.
The Stats chart is saved when the log listing is saved.
DELTAS: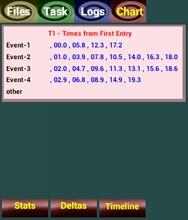
Displays a grid that shows the delta in a timeline.
This grid lists the tasks vertically at left and a chronology progressing to the right. Each grid point equals the delta value for that task at that iteration of the event.
The grid shows only one delta at a time.
Click the Delta button to step through the five delta values.
Usually only two or three deltas will apply to a particular task list, so some delta values won't make any sense.
All five delta charts are saved to the SUM file when the log listing is saved.
TIMELINE:
Draws a timeline graph of logged items in chronological order.
This grid lists the tasks vertically at left and a chronology progressing to the right.
The chronology is not scaled proportionally, it merely plots each point in order.
The Graph panel draw three kinds of graphs,
which are selected via the three buttons at bottom.
STATS:
Draws a chart of counts and times for each task item.
Each task will list these stats:
Average or Sum of all Delta-Times for each task.
Click the Stats button to toggle between Average and Sum.
The Delta section below has extensive details.
This could happen if you remove or respell an item.
The Stats chart is saved when the log listing is saved.
DELTAS:
Displays a grid that shows the delta in a timeline.
This grid lists the tasks vertically at left and a chronology progressing to the right. Each grid point equals the delta value for that task at that iteration of the event.
The grid shows only one delta at a time.
Click the Delta button to step through the five delta values.
Usually only two or three deltas will apply to a particular task list, so some delta values won't make any sense.
All five delta charts are saved to the SUM file when the log listing is saved.
TIMELINE:
Draws a timeline graph of logged items in chronological order.
This grid lists the tasks vertically at left and a chronology progressing to the right.
The chronology is not scaled proportionally, it merely plots each point in order.
Use the LAYOUT screen to adjust the screen dimensions.
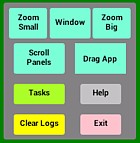
Use ZOOM SMALL and ZOOM BIG to adjust the window and component sizes between 100-200%. 100% is the size of a typical cell phone.
Use Window & Full Screen to adjust the app size.
WINDOW = movable floating window to show under the app.
FULL SCREEN = covers whole screen to show more of the app.
Zoom will apply to both Window and Full.
Use your finger on the DRAG APP button to drag the app around the screen.
This only works with Window, not Full, and allows you to see under the app.
SCROLL or SNAP = the transition between panels. Snap is a lot faster.
All buttons are labeled with their current state, not the after-click state.
Clear Task List & Clear Log List - will confirm before clearing the lists.
Delta Time Example:
The delta-times display the time difference between a log entry and the entries before it.
They can be confusing but allow for very quick data analysis.
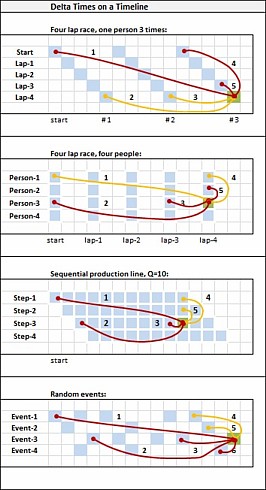
The diagram at right shows four common timelines. The time line moves from left to right with blue squares representing logged points. The red lines show how the deltas are measured from blue squares to the green square. The delta lines are numbered 1 - 5.
On these diagrams, the red deltas are useful and yellow ones don't make any sense.
The most useful deltas are:
Diagram 1, one sequence at a time.
T-1 - full event time.
T-4 - time of third cycle.
T-5 - time to complete step-2.
Diagram 2, 4 at same time.
T-2 - total time for person 3.
T-3 - time for person 3 in lap 4.
T-5 - difference between persons 2 & 3.
Diagram 3, 4 in concurrent sequence.
T-1 - time since the start.
T-2 - time for person 3 to do 8.
T-3 - time for person 3 to do 1.
Diagram 4, random events.
T-1 - time since the start.
T-2 - total time for event 3.
T-3 - time for event 3 to do 1.
T-6 - time from the previous log entry.
Note that an event will usually start with a "start" step, and the remaining log entries will refer to the end of a task.
The Stats chart on the Graph page is the average or sum of these numbers.
The Delta charts on the Graph page shows each of the 5 delta values on a timeline vrs each of the tasks.
The delta-times display the time difference between a log entry and the entries before it.
They can be confusing but allow for very quick data analysis.
The diagram at right shows four common timelines. The time line moves from left to right with blue squares representing logged points. The red lines show how the deltas are measured from blue squares to the green square. The delta lines are numbered 1 - 5.
On these diagrams, the red deltas are useful and yellow ones don't make any sense.
The most useful deltas are:
Diagram 1, one sequence at a time.
T-1 - full event time.
T-4 - time of third cycle.
T-5 - time to complete step-2.
Diagram 2, 4 at same time.
T-2 - total time for person 3.
T-3 - time for person 3 in lap 4.
T-5 - difference between persons 2 & 3.
Diagram 3, 4 in concurrent sequence.
T-1 - time since the start.
T-2 - time for person 3 to do 8.
T-3 - time for person 3 to do 1.
Diagram 4, random events.
T-1 - time since the start.
T-2 - total time for event 3.
T-3 - time for event 3 to do 1.
T-6 - time from the previous log entry.
Note that an event will usually start with a "start" step, and the remaining log entries will refer to the end of a task.
The Stats chart on the Graph page is the average or sum of these numbers.
The Delta charts on the Graph page shows each of the 5 delta values on a timeline vrs each of the tasks.